- Market Facts & Opinions (2000) Ltd
- mfo@mfocaribbean.com
- Tel: (868) 627-8417/8524
Some Bald Facts about T&T Budget 2007 – 2017


Eight out of the last ten years T&T has had a deficit budget. Even when our revenue grew, we spent even more than we earned. Income from our most important contributors – Oil and Companies Taxes- has dropped drastically in the last two years to a point where oil tax revenues equal less than 2% of Government total revenues. Meanwhile, public sector employees have enjoyed salary increases that are now equal to a fifth of all expenses. Public sector salaries and subsidies equal two-thirds of our expenses.

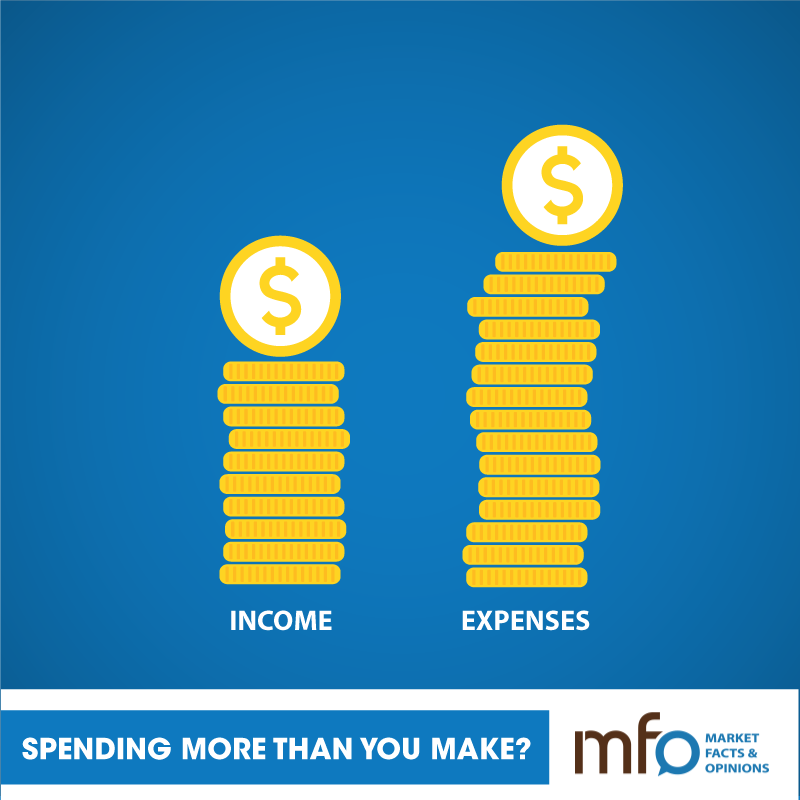
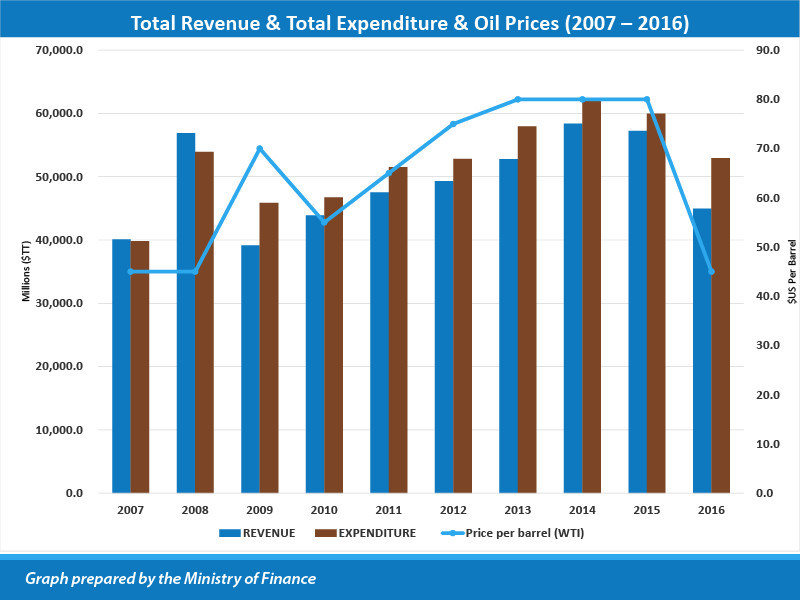
For the ten years under review, 8 of them (2009 – 2016) have budget deficits i.e. the expenses are more than the revenue. This happens when you spend more than you earn.
Note: in 2009 the revenue dropped but our expenses did not drop in line. The revenue recovered in 2010 and for each of the following 5 years it grew but we spent more than its growth. In 2015 the revenue dropped below the previous year for the first time since 2009 but we continued to spend. This was the same year that oil prices collapsed.
There are only three ways to fix a deficit: get more income (exports), reduce your spending (cut the money that you gave to those who live and work here) or take from those who live and work here (taxes) or a mix of these approaches.
Should we have saved more? Could we have saved more? In the 2009 to 2015 period.

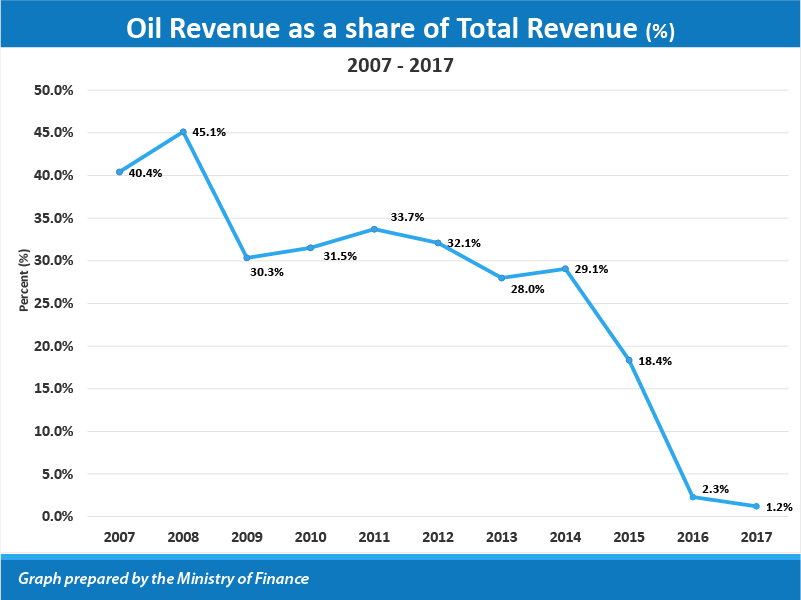
Notice that in 2008 oil revenue stood at 45.1% of Government revenue but by 2015 it had dropped to 18. 4% and now is 1.2%.
Total taxes on Corporate incomes and Profits in 2008 was 33, 000($Mn). For the period 2010 to 2014, it averaged 24,240 ($Mn). In 2015 it was 19,900 ($Mn). In 2016 it shrunk to 8,000 ($Mn).
Should we have seen the decline in oil prices? What could we have done differently if we saw changes in our income coming?

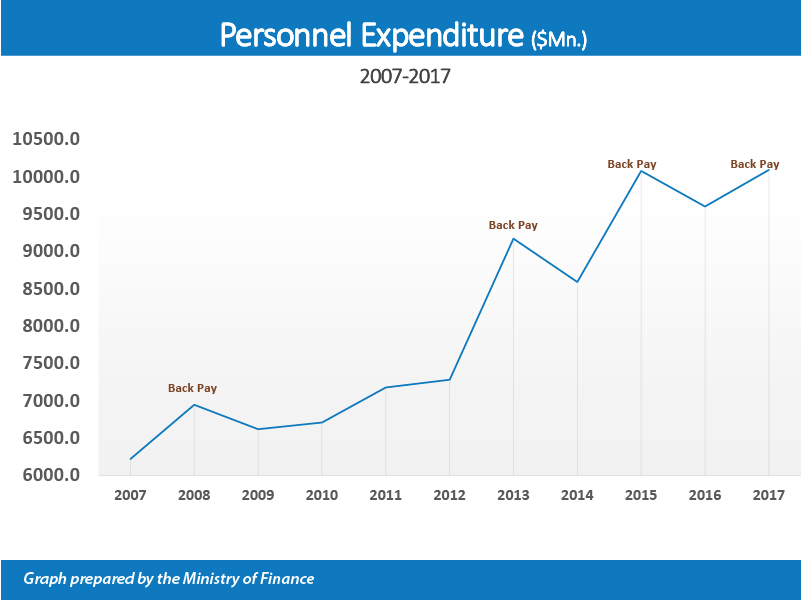
This slide shows the increases for the public sector employees. Note the increases in the payments. The back pays are represented as peaks since they are paid at a point in time so one needs to look at the line of the curve to understand the true impact. It went from 12.9% of total expenses to 19.5% (2008 to 2017).
But this is only part of the story: the transfers (subsidies to households and payments to State Enterprises and Public Utilities) were larger. In 2008, they were 4.2 times larger than the pay for the public servants and then the ratio became lower – 3 times from 2013. Together they accounted for 67% of all expenses in 2008 and rose to 70% in 2016. WASA has been the big expense line averaging 1901 ($Mn) from 2012 to 2017 – a number that is 2.28 times the Port Authority, PTSC and T&TEC combined for the same period.
What can be done if government salaries are nearly 7% more of our total expenses since 2008? What can we do about the transfers and subsidies? Is WASA delivering value for money? Will our recent WASA expenses for new distribution lines etc. give us the water we need?
